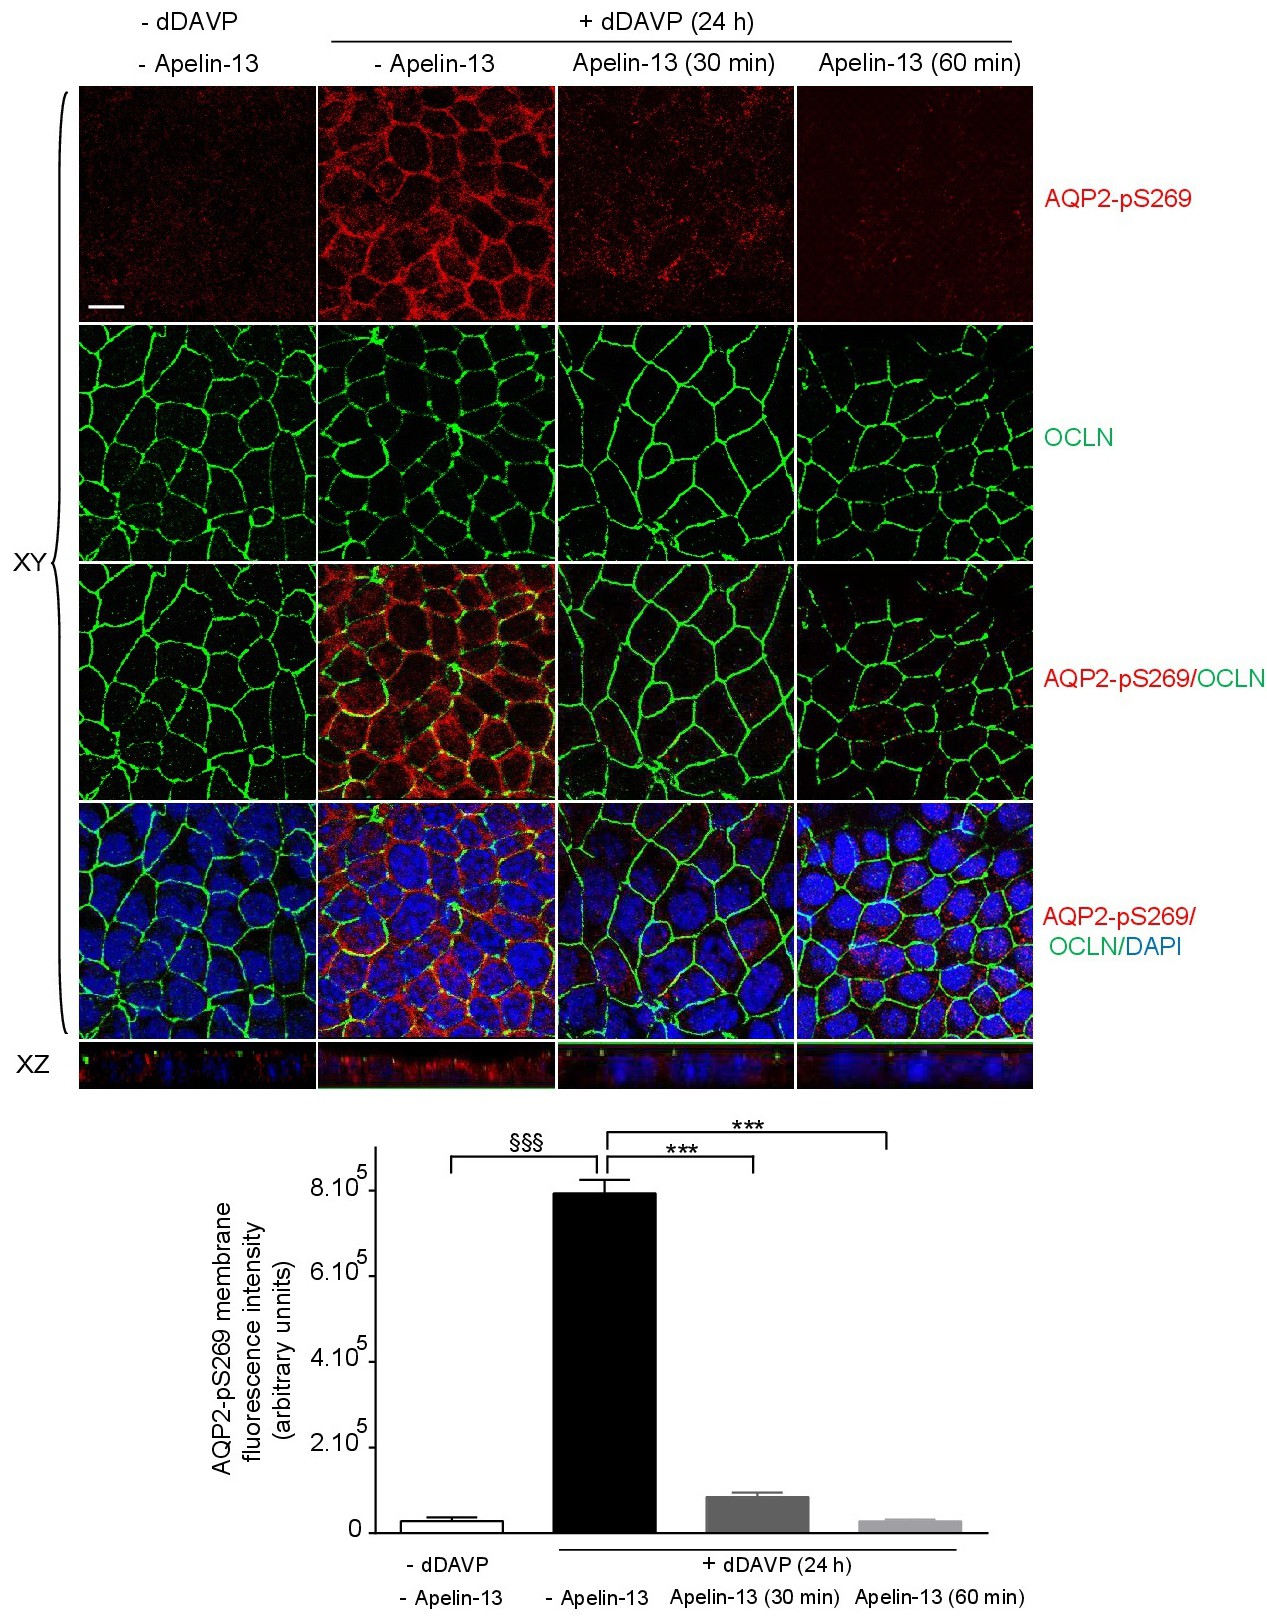
Fig. 6. Representative immunofluorescence images showing the effect of apelin-13 on AQP2-pS269 localization in mpkCCDc14 cells. Cells grown on permeable supports were left untreated (negative control, 1st column) or treated with either dDAVP for 24h (positive control, 2nd column) or with a combination of apelin (for 30 or 60 min, 3rd and 4th columns) and dDAVP. Double immunofluorescence labeling of AQP2-pS269 (red) and occludin (green) was performed using an anti-AQP2-pS269 and anti-OCLN. Nuclei were stained with DAPI (blue). Confocal images are shown in both XY and XZ plans. Scale bar = 5 µm. Localization analysis of AQP2-pS269 represents the means ± SEM of four independent experiments compared to dDAP treatment. §§§ p< 0.001; ***p<0.001 two-way ANOVA with a post-hoc Bonferroni multiple comparison test.